Thanks to oil propaganda, now we’re all pontificating over how much range electric cars lose with cold. I thought therefore to offer at least ONE hard data point, obtained from driving 212,000km with my own electric car, a Hyundai Kona 64kWh MY18.
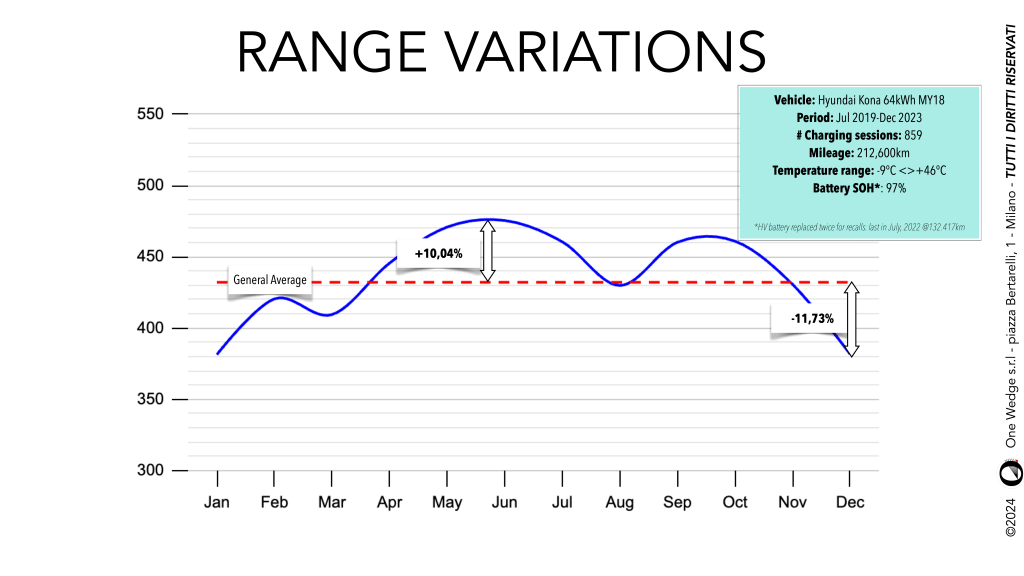
The blue line is the average of range in each month.
The red dashed line is my general average range, about 432km.
As you can see, I get 10% MORE range (around 485km) during the summer and 12% LESS (around 380) during the winter, so the overall variability is roughly 22% but, as you can see, my definition of “cold” is relative to where I live (Northern Italy) and I expect drivers in Scandinavia, Canada or the Northern United States to experience much stiffer winter weathers.
OF COURSE, external temperature is not the only thing affecting range, the other big influence being speed. On average, the highway share of my mileage is about 25%, with the exception of August, where the long highway trip to Sicily makes this percentage much higher (around 55%) hence the August dip in mileage.
I urge other people who might be collecting data NOT to trust a single measurement (or even a small number), because there’s plenty of variables that need averaging before you can draw conclusions.
For example, the above average is really representative of a rather scattered dataset: this is the same data plotted by year (for me, almost incomprehensible) or in enveloped form, where the red dashed line is the blue line in the chart above.

The enveloped chart shows also an almost constant (20-25%) spread around the average from May onwards, but a much tighter one January to April. No idea if this is meaningful or will average over time.
Conclusions
This is a classic case where you can never have enough data: we need more measurements, on more models and even more samples of the same model, for more time.
A step in the right direction, pointed at by someone in the comments, is the dataset collected by Recurrent which shows an overall variability of around 30%: given the fact it includes data for many different car types it gives a broader backing to a “30% range loss” claim.
However the temperature range is probably not wide enough: “ideal vs. freezing” means 0°C to 30°C: I measured the Kona over a wider range (-9°C to +46°C and gotten a significantly lower variance (23%) than the one in the Recurrent chart (+34%).
Besides, the same car model may have different batteries from different manufacturers and therefore exhibit different temperature sensitivity.
In an ideal world, this task should go back to OEM’s: if they want to showcase their car ability to operate well in colder climate, they should agree on a data standard and entrust the data to a third party for analysis, but given the Automotive industry penchant for outright lies when it comes to actual performances, I doubt this will ever happen.
So the only possible solution I see for getting this sort of data in an objective way is a simple data logger connected to an OBDII port of the car, pushing the data through an app installed on the user’s phone to a cloud where an open source group analyzes the data and publishes the results.

Methodology note
When I first published this in abbreviated form on Social Media, people asked me how I collected data: I’m afraid the answer is not so glamorous: I take a picture of my dash every time I connect the car to my wallbox, and of the same wallbox in the morning; then once a week I dump data in big spreadhsheet. Eventually we will be able to dump such data from our cars in a less tedious way (although we will need more integration with the charging equipment to capture charging losses), but for the time being that’s what I do,
