With the pandemic lockdowns behind us, I resumed my typical traveling schedule; here are the key numbers of my e-motoring 2022, finally a representative year:
Mileage
This year I drove 58,172 km, of which 15,507 (about 27%) on highway.
Seasonal distribution of this mileage was almost uniform throughout the year: 23% in winter, 24% in summer and the remainder (53%) during the spring/fall seasons.

In this chart, all values are seasonally adjusted (i.e. they are the total of the last 12 months).
It’s easy to see mileage (grey line, right axis) returning to my typical value around 55,000 km per year after the various pandemic-induced stop&go; also the domestic charging percentage (red line, left axis) which hovered around 95% for about a year (due to fewer work-related travel) returned to a more typical 85%.
Both blue lines are referred to the left axis and represent my savings percentage: the continuous line (savings vs. billed cost) started decreasing in April when my fixed-price electricity contract ran out, while the dotted line (representing net saving, i.e. after deducting pro-rata the savings from the sale of my PV-generated surplus energy) was unchanged around 80%.
Consumption
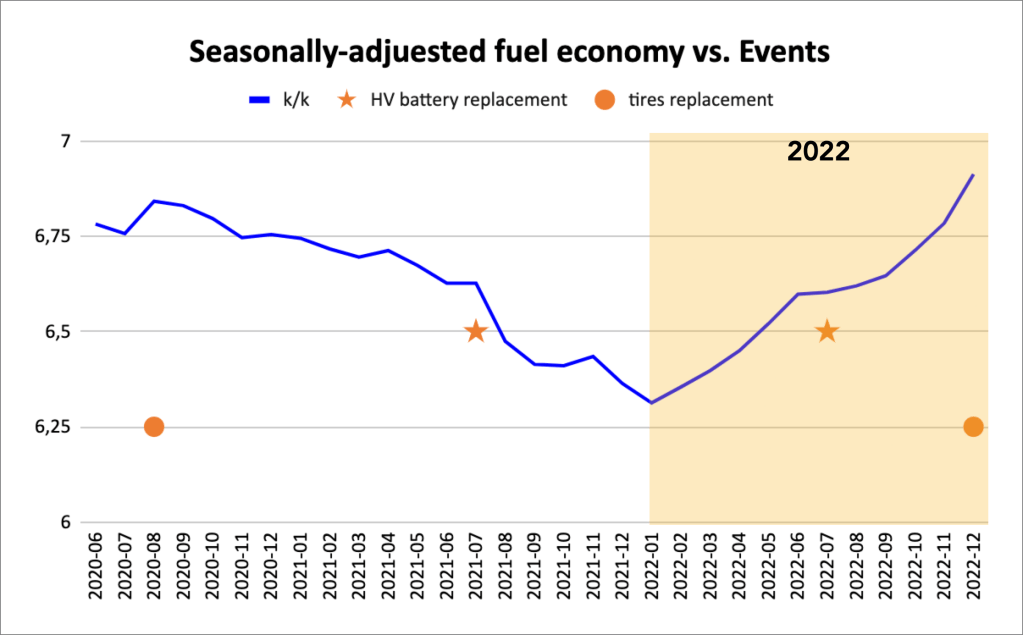
Real total consumption over 12 months was 6.89 km/kWh, equivalent to a 441 km of range (remember this chart is expressed in km/kWh, so if the line “goes up” fuel economy is improving).
I have attempted to find a relationship between the consumption chart a a couple of key events such as the high-voltage battery replacement (star: in July, 2021 and again in July, 2022) or tire change (bullet: August, 2020 and December, 2022) but, frankly, I cannot see any.
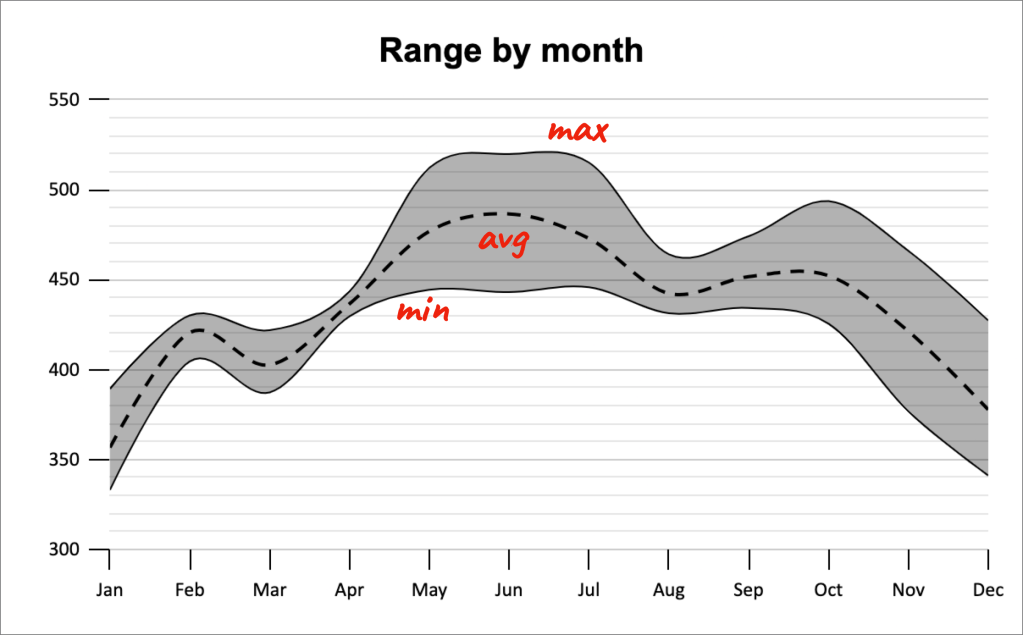

As we know, temperatures greatly influence range, as we can see in the leftmost chart, the envelope of four years of consumption data.
This year, my fuel economy ranged from the 7.18 km/kWh of the summer (=459km of range) whose average was heavily depressed by highway-intensive August, otherwise it would have been around 8.00, and the 6.36 km/kWh of the winter (=407km). In the rightmost chart I plotted the seasonal evolution of fuel economy throughout the years: while the maximum value doesn’t change much from one year to another, the very warm 2022 fall pushed the mid-season segment (green) almost up to the level of the summer segment (yellow).
Charging sessions
During 2022, I charged through 227 sessions, of which 44 (19%) happened on public charging stations and the other 183 (81%) on my domestic wallbox; excluding August, when I charged 26 times out-of-home, I used public chargers only once or twice per month.
Energy distribution was slightly different, though, as out of the total 8,444kWh, only 1,272kWh (16%) were charged out-of-home, with the remainder @home.
This year I continued the practice NOT to charge every day (on average twice weekly) to attempt to reduce charging losses while making sure I had enough range to complete my daily itineraries without the need to stop.
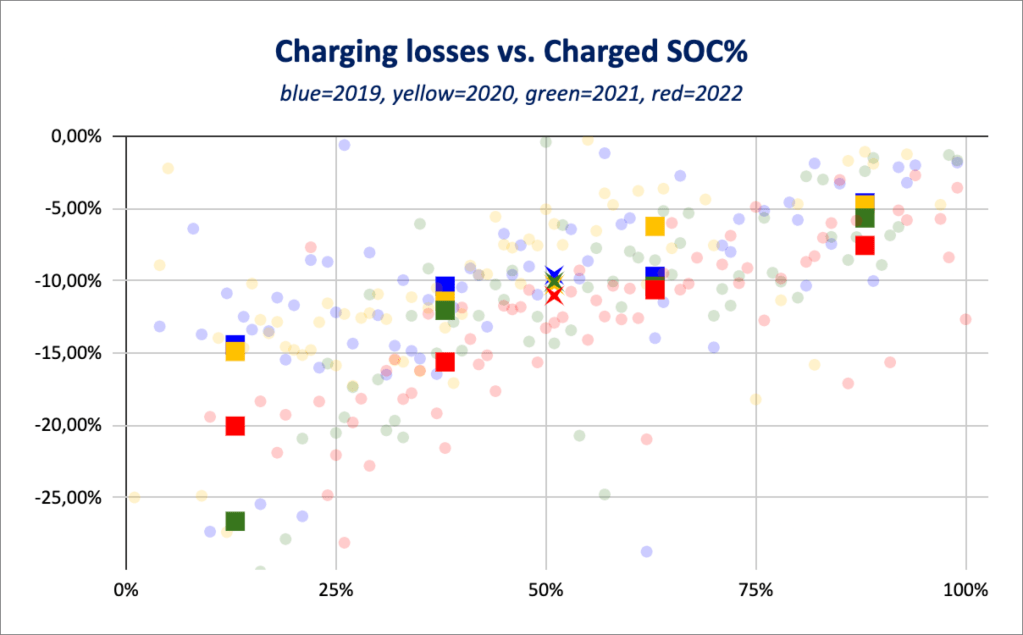

While the general trend of losses growing inversely with the quantity of charge is still very true (leftmost chart) I noticed a general worsening of the curve: my average charging session over four years grew from 20kWh to almost 40 (rightmost chart, blue bars, left axis) yet my weighted average charging losses (red line, right axis) worsened, albeit not my much, from -9% to -11%: for lack of a better explanation, I put this behaviour down to a progressive loss of efficiency in circuits, wallbox and battery, even though the latter was replaced twice (last time in July, 2022).
Going back to the left chart, some trends are not immediately explainable (at least not by me, suggestions welcome): for example the unusually low efficiency of small charging sessions of 2021 or the almost identical efficiencies in the second and third quartile in both 2020 and 2021.
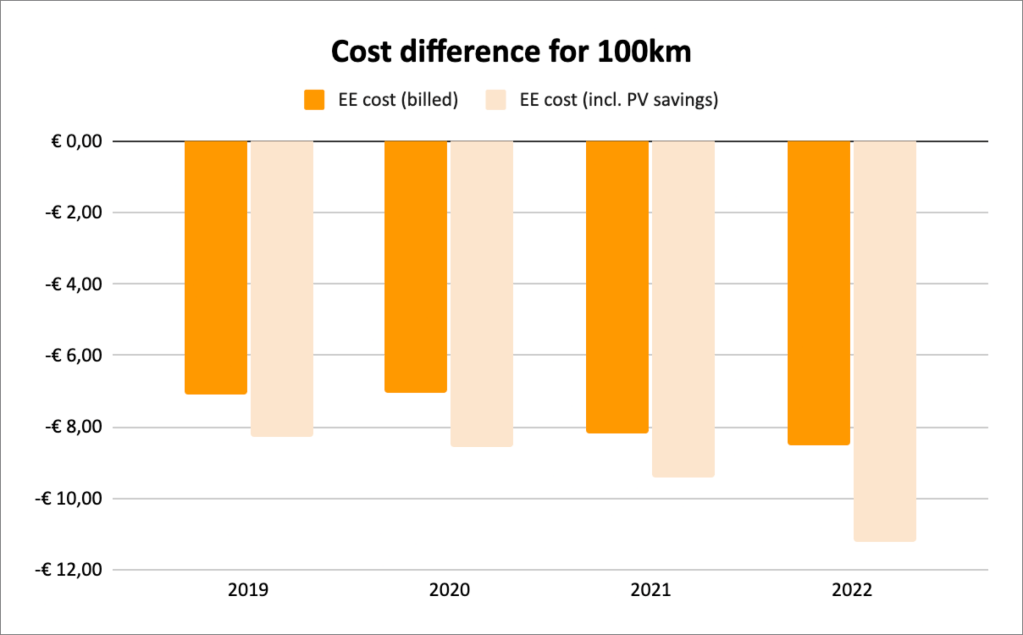
Expense
My total cost for charging in 2022 was €2,909, of which €541 were spent at public charging stations and €2,368 for charging @home; when I account pro-rata for my PV-generated surplus energy sold to the grid, the latter cost decreases to €767.
If I had done the same mileage with my old diesel car, my fuel cost would have been €7,830, so I saved about 63% (which becomes 83% after surplus energy income).
In all, 100km costed me €5.00 (€2.25 net of surplus income) instead of €13.46.
During the three-and-a-half years I had the Kona, I saved about €15,000 in fuel costs; at this rate I forecast that at the end of 5 years the car will have more than repaid the purchase price differential (about €20,000) on fuel cost savings alone.
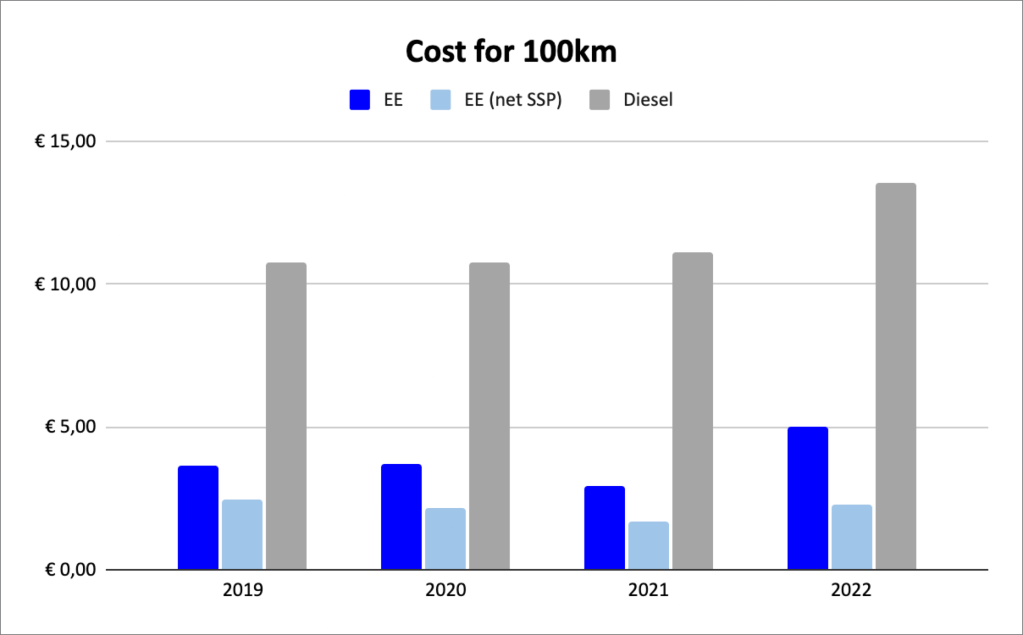
It’s interesting to note that even in this very challenging year for energy costs, my savings (even without accounting for the additional PV-related savings) have actually INCREASED, due to the fact that while fossil fuel costs are unmanageable (i.e. they are entirely in the hands of suppliers), electrical energy costs can be managed through negotiation, flat-fee contracts or self-production.
